Observability in cloud-native applications is crucial, offering deep insights into system behavior and performance. This detailed guide explores how to achieve this through the strategic use of logging, metrics, and tracing. We’ll examine the core concepts, best practices, and essential tools to help you effectively monitor and manage your cloud-native environments.
This guide will cover everything from understanding the three pillars of observability and implementing robust logging strategies to setting up effective monitoring and distributed tracing in microservices architectures. We will delve into the tools and technologies that can help you achieve optimal observability and the best practices for cloud-native environments.
Core Concepts of Observability
Observability is crucial for understanding and managing the complexities of cloud-native applications. It provides insights into the internal states of a system by analyzing its external outputs. This section explores the core concepts that underpin observability, specifically focusing on its three pillars: logging, metrics, and tracing. These pillars, when implemented effectively, enable developers and operations teams to quickly identify, diagnose, and resolve issues, ultimately leading to more reliable and performant applications.
The Three Pillars of Observability
The foundation of a robust observability strategy rests upon three key pillars: logging, metrics, and tracing. Each pillar offers a unique perspective on the application’s behavior, and when combined, they provide a comprehensive understanding of the system’s health and performance.
- Logging: Logging involves recording discrete events that occur within the application. These events, often in the form of text-based messages, capture details such as errors, warnings, informational messages, and debug statements. Logs are essential for understanding the sequence of events leading up to an issue, identifying the root cause of errors, and auditing application behavior. Effective logging includes contextual information, such as timestamps, log levels (e.g., DEBUG, INFO, WARN, ERROR), and unique identifiers (e.g., request IDs) to facilitate correlation and analysis.
- Metrics: Metrics are numerical measurements of various aspects of the application’s performance and resource utilization. They provide a quantitative view of the system’s health and can be used to track trends, identify anomalies, and trigger alerts. Common metrics include CPU usage, memory consumption, request latency, error rates, and throughput. These metrics are typically collected at regular intervals and aggregated to provide a high-level overview of the system’s behavior over time.
- Tracing: Tracing provides a way to follow a request as it flows through a distributed system. It involves tracking the execution of a request across multiple services and components, capturing timing information and other relevant data at each step. Traces are composed of spans, which represent individual units of work within a service. By analyzing traces, developers can identify performance bottlenecks, understand the dependencies between services, and troubleshoot issues that span multiple components.
How Pillars Work Together: Troubleshooting an Issue
The true power of observability lies in the ability to correlate data from all three pillars. Let’s consider a scenario where a user reports slow response times when accessing a specific feature in a cloud-native application. Here’s how the three pillars work together to troubleshoot this issue:
- Identifying the Problem with Metrics: First, the operations team might notice an increase in the average request latency for the affected feature using metrics dashboards. This initial observation indicates a performance degradation.
- Drilling Down with Tracing: Next, by examining the traces associated with the slow requests, they can pinpoint which service or component is experiencing the delay. The trace data might reveal that a particular database query within a specific service is taking an unusually long time to complete.
- Root Cause Analysis with Logging: Finally, they can examine the logs generated by the problematic service to understand why the database query is slow. The logs might reveal errors, such as connection timeouts, or they might show that the query is inefficient due to a lack of indexing. The logs, correlated with the trace and metric data, will ultimately reveal the root cause of the performance issue.
This example illustrates how the combined use of metrics, tracing, and logging provides a holistic view of the system’s behavior, enabling rapid diagnosis and resolution of issues.
Benefits of a Well-Defined Observability Strategy
Implementing a well-defined observability strategy offers several significant benefits, contributing to improved application performance, faster issue resolution, and increased developer productivity.
- Faster Issue Resolution: Observability tools and practices enable faster identification and resolution of issues. By providing detailed insights into application behavior, teams can quickly pinpoint the root cause of problems, reducing the mean time to resolution (MTTR). This ultimately minimizes downtime and improves the overall user experience.
- Improved Application Performance: Observability allows teams to proactively monitor application performance and identify performance bottlenecks. By analyzing metrics, traces, and logs, they can optimize code, infrastructure, and resource allocation, leading to improved application speed, responsiveness, and scalability. For example, by identifying slow database queries through tracing and logging, developers can optimize those queries to improve overall performance.
- Proactive Problem Detection: A robust observability strategy facilitates proactive problem detection. By setting up alerts based on key metrics and analyzing trends in logs and traces, teams can identify potential issues before they impact users. This proactive approach allows for timely intervention, preventing major outages and minimizing disruptions.
- Enhanced Developer Productivity: Observability tools empower developers to understand the behavior of their applications more effectively. By providing insights into code execution, performance, and error patterns, developers can debug issues more efficiently and optimize their code for better performance. This ultimately leads to increased productivity and faster development cycles.
- Better Collaboration and Communication: Observability fosters better collaboration and communication between development, operations, and other teams. By providing a shared understanding of application behavior, observability tools and practices enable teams to work together more effectively to identify, diagnose, and resolve issues. This promotes a culture of shared responsibility and continuous improvement.
In essence, a well-defined observability strategy transforms a reactive approach to problem-solving into a proactive one, leading to more resilient, performant, and maintainable cloud-native applications.
Cloud-Native Application Architecture and Observability
Cloud-native applications, built to leverage the benefits of cloud computing, present unique challenges and opportunities for observability. These applications, often designed with principles like microservices, containerization, and automation, demand a different approach to monitoring, logging, and tracing compared to traditional, monolithic architectures. Understanding these differences is crucial for effectively managing and troubleshooting cloud-native applications.
Observability in Cloud-Native Architectures Versus Traditional Architectures
Observability takes on a different dimension in cloud-native environments. The dynamic nature of these applications, with their frequent deployments, scaling, and ephemeral resources, necessitates a more sophisticated approach to gathering and analyzing data. Traditional monitoring tools, designed for static environments, often fall short in cloud-native settings.
- Scale and Complexity: Cloud-native applications, particularly those built on microservices, are inherently more complex than monolithic applications. This complexity stems from the distributed nature of the services, the interactions between them, and the underlying infrastructure. Observability solutions must be able to handle the vast amounts of data generated by these complex systems.
- Dynamic Environments: Cloud-native environments are highly dynamic. Resources are often provisioned and de-provisioned automatically, and applications are frequently updated. Observability tools must be able to adapt to these changes in real-time, providing insights into the current state of the system.
- Ephemerality: Containers and other cloud-native components are often short-lived. This means that traditional methods of collecting data, such as agent-based monitoring, may not be effective. Observability solutions must be able to collect data from these ephemeral resources quickly and efficiently.
- Decentralized Ownership: In cloud-native environments, development and operations teams are often decentralized, with different teams responsible for different services. Observability solutions must provide a unified view of the entire system, enabling teams to collaborate effectively and troubleshoot issues quickly.
Monolithic vs. Microservices Architectures and Their Impact on Observability
The choice of architecture—monolithic or microservices—significantly impacts the observability strategy. Microservices, with their distributed nature, present more complex observability challenges but also offer opportunities for more granular monitoring and analysis.
- Monolithic Architecture: In a monolithic architecture, all application components are bundled into a single unit. This simplifies observability, as all logs, metrics, and traces are typically contained within a single application instance. However, troubleshooting can be challenging, as a single issue can affect the entire application.
- Microservices Architecture: Microservices architectures decompose an application into a collection of small, independent services. Each service is responsible for a specific function and can be developed, deployed, and scaled independently. This architecture offers several benefits, including increased agility, scalability, and resilience. However, it also introduces significant observability challenges.
Observability in a microservices environment must address the following:
- Distributed Tracing: Tracing is essential to follow the flow of a request as it traverses multiple services. This allows developers to identify performance bottlenecks and pinpoint the root cause of errors.
- Service-to-Service Communication: Understanding the communication patterns between services is crucial for troubleshooting issues. This includes monitoring latency, error rates, and the volume of traffic between services.
- Log Aggregation and Correlation: Logs from different services must be aggregated and correlated to provide a unified view of the system. This allows developers to understand the context of events and identify patterns.
- Automated Alerting: Automated alerting is essential to detect and respond to issues quickly. Alerts should be based on metrics, logs, and traces, and should be tailored to the specific needs of each service.
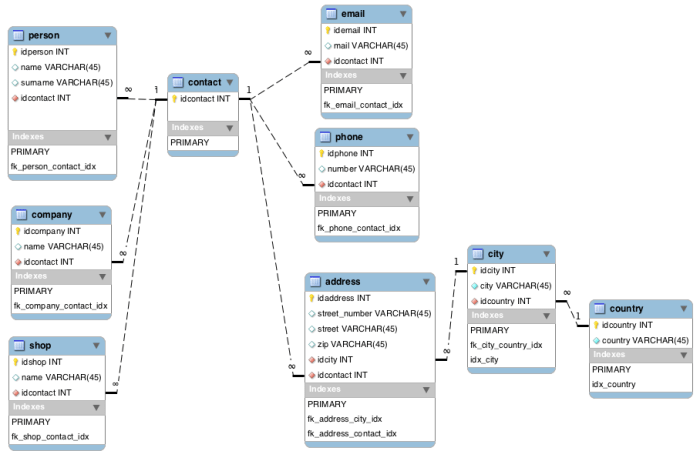
Diagram: Data Flow in a Microservices Environment with Observability Tools Integrated
The following diagram illustrates the flow of data in a microservices environment with observability tools integrated.
Diagram Description:
The diagram depicts a simplified microservices architecture and how observability tools interact with it. It shows a client initiating a request that flows through several microservices.
Client
The starting point, representing a user or another application making a request.
API Gateway
Acts as the entry point for all requests, routing them to the appropriate microservices.
Microservices (Service A, Service B, Service C)
Represent the individual services that handle specific functionalities. Each service is instrumented to emit logs, metrics, and traces.
Observability Tools (Metrics, Logging, Tracing)
Metrics
Data collection of time-series data (CPU usage, memory usage, request latency, etc.). Tools like Prometheus or Datadog are commonly used.
Logging
Collection and aggregation of log data from all services. Tools like Elasticsearch, Fluentd, and Kibana (EFK stack) or Splunk are used.
Tracing
Tracking requests as they flow through the services. Tools like Jaeger, Zipkin, or AWS X-Ray are used to provide distributed tracing.
Data Flow
Arrows show the flow of the request and the flow of observability data:
The client sends a request to the API Gateway, which then routes it to the microservices.
Each microservice generates logs, metrics, and traces.
Logs are sent to a centralized logging system.
Metrics are sent to a metrics aggregation system.
Traces are sent to a tracing system.
Dashboard and Alerting
The Observability tools provide dashboards to visualize data and alert mechanisms to notify teams of issues.
This diagram illustrates how observability tools collect data from each service, allowing for comprehensive monitoring, troubleshooting, and performance analysis in a microservices environment.
Implementing Logging in Cloud-Native Applications
Logging is a fundamental pillar of observability, providing crucial insights into the behavior and performance of cloud-native applications. Effective logging allows developers and operations teams to diagnose issues, monitor application health, and gain a deeper understanding of how their applications are functioning in a distributed, dynamic environment. This section delves into the best practices for implementing logging in cloud-native applications, focusing on structured logging and centralized log management.
Best Practices for Logging in a Cloud-Native Environment
Cloud-native environments, characterized by their dynamic and distributed nature, demand a refined approach to logging. Adhering to best practices ensures that logs are useful, accessible, and contribute effectively to observability.
- Structured Logging: Embrace structured logging formats like JSON. This enables easy parsing, filtering, and analysis of log data. Instead of free-text log messages, structured logs use key-value pairs to provide context and make logs machine-readable. For instance, instead of a log message like “User login failed for user ‘john.doe'”, a structured log might look like:
"timestamp": "2024-10-27T10:00:00Z",
"level": "ERROR",
"message": "User login failed",
"user_id": "john.doe",
"ip_address": "192.168.1.100",
"service": "auth-service"This structured format allows for easy filtering by user ID, IP address, or service, providing granular insights.
- Consistent Logging Levels: Establish and consistently use standard logging levels (e.g., DEBUG, INFO, WARN, ERROR, FATAL). This provides a clear indication of the severity of events and allows for efficient filtering based on the criticality of issues. A DEBUG level is useful for detailed information during development, while ERROR or FATAL indicate critical problems that need immediate attention.
- Contextual Information: Include relevant context in log messages. This means incorporating information like timestamps, service names, request IDs, trace IDs, and any other data that helps correlate events across different services and components. This is crucial for debugging distributed systems where a single request may traverse multiple services.
- Avoid Sensitive Data: Never log sensitive information like passwords, API keys, or personally identifiable information (PII). Implement redaction or masking techniques to protect sensitive data. This is crucial for security and compliance reasons.
- Log Rotation and Retention: Implement log rotation and retention policies to manage log storage and prevent disk space exhaustion. Define how long logs are kept based on compliance requirements and operational needs. Tools like `logrotate` (for Linux) or cloud-provider-specific solutions are essential for this.
- Asynchronous Logging: Use asynchronous logging to avoid blocking application threads. This ensures that logging doesn’t negatively impact application performance. Libraries often provide options for asynchronous logging.
- Logging Libraries: Leverage established logging libraries and frameworks. Popular choices include Log4j (Java), Python’s `logging` module, and Winston (Node.js). These libraries provide features like log formatting, level filtering, and output destinations.
- Centralized Log Management: Implement a centralized logging system to collect, store, and analyze logs from all services and components. This is essential for correlating events, identifying trends, and performing root cause analysis. Tools like the ELK stack or Splunk are commonly used for this purpose.
Common Logging Formats and Their Advantages/Disadvantages
The choice of logging format significantly impacts the usability and effectiveness of log data. Different formats offer varying advantages and disadvantages, and the best choice often depends on the specific requirements of the application and the chosen logging infrastructure.
- Plain Text:
- Advantages: Simple to implement, human-readable.
- Disadvantages: Difficult to parse programmatically, lacks structure, prone to inconsistencies.
- JSON (JavaScript Object Notation):
- Advantages: Structured, machine-readable, easy to parse, widely supported.
- Disadvantages: Can be verbose, requires a parser.
Example:
"timestamp": "2024-10-27T10:00:00Z", "level": "INFO", "message": "Service started" - CSV (Comma-Separated Values):
- Advantages: Simple, space-efficient.
- Disadvantages: Limited support for complex data structures, difficult to read and interpret for humans, potential for escaping issues.
Example:
2024-10-27T10:00:00Z,INFO,Service started - Key-Value Pairs (e.g., “key=value”):
- Advantages: Human-readable, relatively easy to parse.
- Disadvantages: Less structured than JSON, can be inconsistent, requires a custom parser.
Example:
timestamp=2024-10-27T10:00:00Z level=INFO message="Service started" - Protobuf (Protocol Buffers):
- Advantages: Efficient, compact, highly structured, supports schema evolution.
- Disadvantages: Requires defining a schema, more complex to implement.
Implementing Centralized Logging
Centralized logging is a cornerstone of observability in cloud-native applications. It aggregates logs from all services and components into a central location, enabling comprehensive analysis and troubleshooting. Tools like the ELK stack (Elasticsearch, Logstash, Kibana) and Splunk are popular choices for implementing centralized logging.
- ELK Stack (Elasticsearch, Logstash, Kibana):
- Logstash: Acts as a log shipper and processor. It collects logs from various sources, transforms them (e.g., parsing, filtering, enriching), and sends them to Elasticsearch.
Example: A Logstash configuration file might include an input section to receive logs from a file, a filter section to parse JSON logs, and an output section to send the processed logs to Elasticsearch.
- Elasticsearch: A powerful search and analytics engine that stores and indexes the logs. It allows for fast searching and analysis of large volumes of log data.
Example: Elasticsearch can be used to search for specific error messages, identify trends, and create visualizations of log data.
- Kibana: A web-based user interface for visualizing and exploring the log data stored in Elasticsearch. It provides dashboards, charts, and other tools for analyzing log data.
Example: Kibana dashboards can be created to display key metrics, such as the number of errors per minute or the average response time of a service.
- Logstash: Acts as a log shipper and processor. It collects logs from various sources, transforms them (e.g., parsing, filtering, enriching), and sends them to Elasticsearch.
- Splunk:
- Splunk is a commercial log management and analytics platform that offers similar functionality to the ELK stack. It provides robust search capabilities, powerful analytics, and a user-friendly interface.
- Splunk Architecture: Splunk consists of several components, including forwarders (to collect logs), indexers (to store and index logs), and search heads (to provide the user interface and search capabilities).
Example: A Splunk deployment might involve installing forwarders on each server or container to collect logs and sending them to a central Splunk indexer for processing and analysis.
- Implementation Steps:
- Choose a Centralized Logging Solution: Select a tool like the ELK stack or Splunk based on factors such as cost, scalability, features, and operational expertise.
- Install and Configure Log Shippers: Install log shippers (e.g., Filebeat for the ELK stack, Splunk Universal Forwarder) on each server or container that generates logs. Configure them to forward logs to the central logging server.
- Configure Log Parsing and Transformation: Configure the central logging solution to parse and transform the log data. This typically involves defining parsing rules for different log formats and applying transformations to extract relevant information.
- Define Retention Policies: Establish retention policies to manage log storage and ensure compliance with regulatory requirements.
- Create Dashboards and Alerts: Create dashboards and alerts to monitor key metrics, identify anomalies, and receive notifications of critical events.
- Considerations:
- Scalability: Ensure the centralized logging solution can handle the volume of logs generated by the application.
- Security: Implement appropriate security measures to protect log data, including access control, encryption, and audit trails.
- Cost: Factor in the cost of storage, processing, and licensing when selecting a centralized logging solution.
- Maintenance: Plan for ongoing maintenance and updates to the centralized logging solution.
Metrics and Monitoring for Cloud-Native Applications
In cloud-native environments, effective monitoring is paramount. It allows for proactive identification of issues, optimization of performance, and ensures the overall health and reliability of the application. Metrics provide the quantifiable data necessary for this monitoring, enabling informed decision-making and automated responses to changing conditions. This section delves into the critical aspects of metrics and monitoring in cloud-native applications, providing practical examples and highlighting essential tools.
Key Performance Indicators (KPIs) and Service Level Indicators (SLIs)
Defining and tracking appropriate KPIs and SLIs is crucial for assessing the performance and health of a cloud-native application. KPIs represent the overall business goals, while SLIs are specific metrics that measure the performance of the application from a user’s perspective.
- Key Performance Indicators (KPIs): KPIs measure the success of the application in relation to business objectives. They are often high-level and provide a broad view of performance. Examples include:
- Revenue: The total income generated by the application.
- Customer Acquisition Cost (CAC): The cost associated with acquiring a new customer.
- Customer Retention Rate: The percentage of customers who continue to use the application over a specific period.
- Conversion Rate: The percentage of users who complete a desired action (e.g., making a purchase).
- Monthly Active Users (MAU): The number of unique users who interact with the application each month.
- Service Level Indicators (SLIs): SLIs are specific metrics that measure the performance of the application from a user’s perspective. They provide a quantifiable measure of the service’s performance. Examples include:
- Latency: The time it takes to fulfill a request. For example, the time taken for a web page to load or for an API call to return a response.
- Error Rate: The percentage of requests that result in an error. This is often expressed as the number of errors per minute or the percentage of failed requests.
- Availability: The percentage of time the service is operational and accessible. For instance, 99.9% availability means the service is unavailable for a maximum of 8.76 hours per year.
- Throughput: The number of requests processed per unit of time. This could be requests per second (RPS) or transactions per minute (TPM).
- Saturation: The extent to which a resource (e.g., CPU, memory) is being utilized. This helps identify bottlenecks and resource constraints.
Using Metrics to Monitor Application Health, Performance, and Resource Utilization
Metrics provide a wealth of information that can be used to monitor various aspects of a cloud-native application. By analyzing these metrics, developers and operations teams can gain valuable insights into application behavior, identify performance bottlenecks, and optimize resource utilization.
- Application Health: Monitoring application health involves tracking metrics that indicate the overall well-being of the application. These metrics can reveal issues like crashes, errors, and slow response times.
- Error Rate: A sudden increase in error rate can indicate a bug in the code, a problem with dependencies, or an infrastructure issue.
- CPU Utilization: High CPU utilization can indicate a performance bottleneck or an inefficient algorithm.
- Memory Usage: Excessive memory usage can lead to performance degradation and potential crashes.
- Response Time: Slow response times can negatively impact user experience and indicate performance issues.
- Application Performance: Monitoring application performance focuses on measuring how efficiently the application is serving requests and delivering results.
- Latency: Tracking latency helps identify slow-performing parts of the application. For example, a sudden increase in latency for database queries could indicate a problem with the database server or inefficient query design.
- Throughput: Monitoring throughput helps understand the application’s capacity to handle traffic. A decrease in throughput, while latency remains constant, could signal an issue with the application’s ability to scale.
- Requests per Second (RPS): Tracking RPS provides a measure of the application’s ability to handle incoming requests. An unusually low RPS during peak hours can suggest scalability problems.
- Resource Utilization: Monitoring resource utilization helps ensure that the application is using resources efficiently and that resources are scaled appropriately.
- CPU Utilization: Monitoring CPU usage helps identify potential bottlenecks and opportunities for optimization. High CPU utilization can signal a need for more resources or code optimization.
- Memory Usage: Tracking memory usage helps ensure that the application has sufficient memory to operate without performance degradation.
- Disk I/O: Monitoring disk I/O helps identify potential bottlenecks related to disk access. High disk I/O can slow down application performance.
- Network Traffic: Monitoring network traffic helps identify issues related to network bandwidth and latency.
Setting Up Alerts Based on Metric Thresholds
Alerting is a critical component of monitoring in cloud-native environments. It allows for proactive detection of issues and enables automated responses. Tools like Prometheus and Grafana are commonly used to set up alerts based on metric thresholds.
- Prometheus: Prometheus is an open-source monitoring system that collects and stores metrics. It uses a time-series database to store metrics and provides a powerful query language called PromQL for querying and analyzing data.
- Grafana: Grafana is a data visualization and dashboarding tool that integrates with Prometheus and other data sources. It allows users to create dashboards that display metrics in a visually appealing and informative way. Grafana also supports setting up alerts based on metric thresholds.
- Alerting Workflow:
- Define Alerting Rules: Based on SLIs, define alerting rules that specify the conditions under which an alert should be triggered. For example, an alert could be triggered if the error rate exceeds a certain threshold (e.g., 5%) for a specific duration (e.g., 5 minutes).
- Configure Alert Notifications: Configure notifications to be sent when an alert is triggered. Notifications can be sent via email, Slack, PagerDuty, or other communication channels.
- Monitor and Respond: Monitor alerts and take appropriate action when an alert is triggered. This may involve investigating the root cause of the issue, scaling resources, or deploying a fix.
For example, consider a scenario where the latency of a web application suddenly increases. A monitoring system like Prometheus can collect latency metrics and trigger an alert if the average latency exceeds a defined threshold (e.g., 500 milliseconds) for a specific duration (e.g., 5 minutes). The alert can then notify the operations team, allowing them to investigate the cause of the increased latency and take corrective action.
Distributed Tracing in Microservices Architectures
In the realm of cloud-native applications, particularly those built with a microservices architecture, understanding the flow of requests across various services is paramount for effective debugging, performance optimization, and overall system health. Distributed tracing emerges as a crucial technique for achieving this visibility. It allows developers to track a single request as it traverses multiple services, providing a comprehensive view of its journey.
This visibility is crucial in diagnosing issues and identifying performance bottlenecks in complex, distributed systems.
Concept of Distributed Tracing and its Importance in Microservices
Distributed tracing provides a mechanism to follow a single request as it propagates through a microservices architecture. It’s essentially a way to log the path a request takes as it moves from one service to another, including the time spent in each service and any dependencies it might have. This offers a granular view of how requests are handled and where potential problems might arise.The importance of distributed tracing in microservices stems from several factors:
- Debugging Complex Issues: In a microservices environment, a single request can involve dozens or even hundreds of services. When an issue occurs, pinpointing the source of the problem can be incredibly difficult without tracing. Distributed tracing allows developers to follow the request’s path and identify the specific service or component causing the issue.
- Performance Monitoring and Optimization: Tracing helps identify performance bottlenecks. By analyzing the time spent in each service, developers can identify slow-performing services and optimize them, leading to improved overall application performance.
- Understanding Service Dependencies: Tracing provides a clear picture of the dependencies between services. This understanding is vital for making changes to the architecture and anticipating the impact of those changes.
- Improved Service Level Agreement (SLA) Compliance: By monitoring the end-to-end latency of requests, tracing helps ensure that services meet their SLA targets.
- Root Cause Analysis: When a failure occurs, tracing data can be used to quickly identify the root cause by revealing the sequence of events and the interactions between services that led to the failure.
Using Tracing Tools: Jaeger and Zipkin
Several tools are available for implementing distributed tracing, with Jaeger and Zipkin being among the most popular. Both are open-source projects designed to collect and visualize trace data, providing insights into the behavior of distributed systems.Jaeger, originally developed by Uber, and Zipkin, initially created by Twitter, share similar core functionalities:
- Instrumentation: This involves adding code to your services to generate trace data. This is typically done using language-specific libraries or agents that automatically instrument your code.
- Data Collection: The trace data, often referred to as spans, are sent to a collector. Collectors are responsible for receiving spans from the instrumented services.
- Storage: The collected spans are stored in a backend, such as Cassandra, Elasticsearch, or a dedicated tracing database.
- Visualization: A user interface allows developers to search for traces, view the request path, and analyze performance metrics.
Both tools follow the principles of the OpenTracing standard (now part of OpenTelemetry), making it easier to switch between them if needed. They provide similar functionalities, but there are some key differences:
- Jaeger: Offers features like adaptive sampling, storage backend options, and a UI that is designed to handle large-scale tracing data.
- Zipkin: Has a simpler setup and is often preferred for smaller projects. It supports various storage backends and provides a user-friendly UI.
The choice between Jaeger and Zipkin often depends on the project’s scale, specific requirements, and the existing infrastructure. Both tools offer robust capabilities for distributed tracing.To use either tool, you typically follow these steps:
- Choose a Tracing Library: Select a library that supports your programming language and the chosen tracing tool (Jaeger or Zipkin). Examples include OpenTelemetry SDKs, or libraries specifically designed for Jaeger or Zipkin.
- Instrument Your Services: Add the tracing library to your services and configure it to send traces to your chosen tracing backend. This usually involves creating spans at the beginning and end of each request, and propagating trace context across service boundaries.
- Deploy and Run: Deploy your instrumented services. As requests flow through your system, trace data will be generated and sent to the tracing backend.
- Analyze Traces: Use the UI provided by Jaeger or Zipkin to search for traces, view the request path, and analyze performance metrics.
Implementing Distributed Tracing in a Sample Microservices Application: A Step-by-Step Procedure
Implementing distributed tracing involves a series of steps that integrate the tracing tool with your application code and infrastructure. The following steps Artikel the process using Jaeger as an example:
- Set up Jaeger: Deploy a Jaeger instance. This can be done using Docker, Kubernetes, or a managed service. A simple Docker Compose file might look like this:
version: "3.8" services: jaeger: image: jaegertracing/all-in-one:latest ports: -"16686:16686" -"14268:14268" environment: -COLLECTOR_ZIPKIN_HTTP_PORT=9411
This sets up Jaeger’s all-in-one image, exposing the UI on port 16686 and the collector on port 14268.
- Choose Your Programming Language and Library: Select the appropriate OpenTelemetry SDK or Jaeger client library for your programming language (e.g., OpenTelemetry for Java, Python, Go, etc.).
- Instrument Your Services: Instrument each of your microservices to generate traces. This involves:
- Initializing the Tracer: Configure the Jaeger tracer to send traces to your Jaeger instance. This configuration usually includes the Jaeger agent’s address and a service name. For example, in Python using the OpenTelemetry SDK:
from opentelemetry import trace from opentelemetry.sdk.resources import Resource from opentelemetry.sdk.trace import TracerProvider from opentelemetry.sdk.trace.export import ( ConsoleSpanExporter, SimpleSpanProcessor, ) from opentelemetry.exporter.jaeger.thrift import JaegerExporter # Configure resources resource = Resource.create( attributes= "service.name": "my-service", "service.version": "1.0.0", ) # Configure the Jaeger exporter jaeger_exporter = JaegerExporter( agent_host_name="localhost", agent_port=6831, ) # Create a TracerProvider tracer_provider = TracerProvider(resource=resource) # Add the Jaeger exporter to the tracer provider tracer_provider.add_span_processor(SimpleSpanProcessor(jaeger_exporter)) # Set the global tracer provider trace.set_tracer_provider(tracer_provider) # Get the tracer tracer = trace.get_tracer(__name__)
- Creating Spans: Wrap critical sections of your code (e.g., request handling, database queries, calls to other services) with spans. A span represents a unit of work. For example:
from opentelemetry import trace tracer = trace.get_tracer(__name__) def my_function(): with tracer.start_as_current_span("my_function_span") as span: # Your code here span.set_attribute("custom_attribute", "some_value") - Propagating Context: Propagate the trace context (trace ID, span ID, and other relevant information) across service boundaries. This is usually done by injecting the context into HTTP headers or other communication mechanisms. Libraries typically handle this automatically when making outbound requests.
- Initializing the Tracer: Configure the Jaeger tracer to send traces to your Jaeger instance. This configuration usually includes the Jaeger agent’s address and a service name. For example, in Python using the OpenTelemetry SDK:
- Deploy and Run Your Services: Deploy your instrumented microservices.
- Generate Traffic: Simulate requests to your application to generate trace data.
- View Traces in the Jaeger UI: Access the Jaeger UI (e.g., at `http://localhost:16686`) and search for traces. You can filter by service name, operation name, and other criteria.
- Analyze Traces: Examine the trace details to understand the request flow, identify performance bottlenecks, and diagnose issues. You can see the time spent in each service, any errors that occurred, and the dependencies between services.
This step-by-step procedure provides a foundation for implementing distributed tracing. The specific implementation details will vary depending on your programming language, framework, and the chosen tracing library. However, the core concepts of instrumentation, data collection, storage, and visualization remain consistent. By implementing distributed tracing, you gain invaluable insights into the behavior of your cloud-native applications, enabling you to build more robust, performant, and maintainable systems.
Observability Tools and Technologies
The landscape of observability tools for cloud-native applications is vast and rapidly evolving. Selecting the right tools is crucial for gaining deep insights into application behavior, identifying performance bottlenecks, and ensuring overall system health. This section explores various open-source and commercial offerings, providing a comparative analysis to aid in informed decision-making.
Open-Source and Commercial Observability Tools
Observability tools provide the mechanisms for understanding the internal states of a system. The choice between open-source and commercial tools depends on factors like budget, in-house expertise, and specific requirements. Open-source tools often offer greater flexibility and customization, while commercial tools typically provide more comprehensive features, dedicated support, and user-friendly interfaces.
- Prometheus: A popular open-source monitoring system designed for collecting and storing time-series data. It excels at collecting metrics from cloud-native applications using a pull-based model. Prometheus integrates seamlessly with Kubernetes and provides powerful query language (PromQL) for data analysis. It’s a good choice for organizations with strong in-house monitoring expertise.
- Grafana: An open-source data visualization and dashboarding tool. Grafana supports a wide variety of data sources, including Prometheus, and enables users to create insightful dashboards for visualizing metrics, logs, and traces. Its flexibility and extensibility make it a valuable component in any observability stack.
- Jaeger: An open-source, distributed tracing system inspired by Google’s Dapper. Jaeger helps trace requests as they traverse through microservices, providing visibility into service interactions and performance bottlenecks. It supports multiple storage backends and offers a user-friendly UI for analyzing traces.
- Zipkin: Another open-source, distributed tracing system, also inspired by Google’s Dapper. Zipkin provides similar functionality to Jaeger, focusing on tracing requests across distributed systems. It offers a REST API for data ingestion and a UI for visualizing traces.
- Elasticsearch, Logstash, and Kibana (ELK Stack): A powerful open-source stack for log management and analysis. Elasticsearch is a search and analytics engine, Logstash is a data processing pipeline, and Kibana is a data visualization tool. The ELK stack is widely used for collecting, processing, and analyzing logs from cloud-native applications.
- Datadog: A commercial observability platform that provides comprehensive monitoring, tracing, and log management capabilities. Datadog offers a unified view of application performance, infrastructure health, and user experience. It integrates with a wide range of technologies and provides automated alerts and anomaly detection.
- Dynatrace: A commercial observability platform focused on automated application performance monitoring (APM) and digital experience monitoring (DEM). Dynatrace uses AI and machine learning to automatically discover and monitor applications, providing real-time insights and problem resolution.
- New Relic: A commercial observability platform offering monitoring, tracing, and log management. New Relic provides comprehensive visibility into application performance, infrastructure health, and user behavior. It offers features such as real-time dashboards, alerts, and anomaly detection.
- Honeycomb: A commercial observability platform focused on understanding complex systems through high-cardinality data and tracing. Honeycomb is particularly well-suited for microservices architectures and provides powerful querying and analysis capabilities.
Tracing Backends: Comparison
Tracing backends store and manage the trace data collected from distributed applications. The choice of a tracing backend significantly impacts the scalability, performance, and cost of the observability solution. Different backends offer various strengths and weaknesses.
- Jaeger: Jaeger is a popular open-source tracing backend. Its strengths include its integration with Kubernetes, its user-friendly UI, and its support for multiple storage backends (e.g., Cassandra, Elasticsearch). However, Jaeger can be challenging to scale in very large environments.
- Zipkin: Zipkin is another open-source tracing backend. It has a simpler architecture compared to Jaeger, which can make it easier to set up and manage. Its strengths include its REST API and its UI for visualizing traces. Zipkin’s scalability may be limited in complex microservices environments.
- Tempo (Thanos): Tempo is a distributed tracing system from Grafana Labs. It is designed to store and query traces at scale, and it integrates well with Prometheus and Grafana. Tempo’s strengths lie in its ability to handle high volumes of trace data and its cost-effectiveness.
- Commercial Backends (e.g., Datadog, New Relic, Dynatrace): Commercial tracing backends offer robust features, scalability, and support. They often provide advanced analytics, anomaly detection, and integrations with other monitoring tools. However, these backends can be more expensive than open-source alternatives.
Observability Tools: Feature and Pricing Comparison
The following table provides a simplified comparison of three observability tools, highlighting key features and pricing models. Note that pricing information is subject to change and may vary based on usage and specific requirements. The data presented is based on the information available at the time of writing.
| Tool | Key Features | Tracing Capabilities | Pricing Model (Example) |
|---|---|---|---|
| Prometheus & Grafana (Open-Source) | Metrics collection, data visualization, alerting, dashboarding, wide community support | Integration with Jaeger and other tracing systems via OpenTelemetry | Free (open-source); costs associated with infrastructure and support |
| Datadog (Commercial) | Comprehensive monitoring, tracing, log management, APM, real-time dashboards, automated alerts, anomaly detection, infrastructure monitoring, user experience monitoring | Full-featured distributed tracing, service maps, and trace analytics | Based on usage (e.g., number of hosts, data ingested). Offers various tiers, including free trial and paid plans. Pricing typically starts at around $15-$20 per host per month. |
| New Relic (Commercial) | Monitoring, tracing, log management, APM, real-time dashboards, alerting, infrastructure monitoring, serverless monitoring, Kubernetes monitoring | Full-featured distributed tracing, service maps, and trace analytics | Based on usage (e.g., data ingested, users). Offers various plans, including a free tier and paid plans. Pricing varies significantly based on features and usage. |
Observability in Different Cloud Environments
Implementing effective observability is crucial in cloud environments, but the approach varies depending on the specific cloud provider. Public cloud platforms offer their own unique services and tools, alongside the option of integrating third-party solutions. Understanding the nuances of each environment is essential for building resilient and performant cloud-native applications.
Specific Considerations for Implementing Observability in Public Cloud Environments
Each major public cloud provider – AWS, Azure, and GCP – presents distinct characteristics that influence observability implementation. These differences stem from the underlying architecture, the services offered, and the pricing models. A tailored strategy is required for each environment to ensure optimal performance and cost-effectiveness.
- AWS: AWS offers a comprehensive suite of observability services, including Amazon CloudWatch for metrics and logs, AWS X-Ray for distributed tracing, and Amazon OpenSearch Service (formerly Elasticsearch Service) for log analytics. AWS’s focus on flexibility allows for the integration of third-party tools. AWS’s vast service ecosystem requires careful planning to select the appropriate services for the specific application architecture.
For instance, applications running on Amazon Elastic Kubernetes Service (EKS) benefit from CloudWatch Container Insights for monitoring and troubleshooting.
- Azure: Azure provides Azure Monitor, a unified monitoring service that consolidates metrics, logs, and traces. Azure Monitor integrates seamlessly with Azure services like Azure App Service and Azure Kubernetes Service (AKS). Azure also supports Azure Application Insights for application performance management (APM). Azure’s strong integration with .NET and other Microsoft technologies can simplify observability for applications built on these platforms.
Consider using Azure Log Analytics for advanced log analysis and alerting.
- GCP: Google Cloud Platform (GCP) offers Google Cloud Operations Suite (formerly Stackdriver), which combines monitoring, logging, and tracing capabilities. GCP’s Cloud Monitoring collects metrics, Cloud Logging manages logs, and Cloud Trace provides distributed tracing. GCP emphasizes a data-driven approach to observability. GCP’s Kubernetes Engine (GKE) integrates deeply with Cloud Operations Suite. The tight integration with Google’s data analytics tools, such as BigQuery, enables powerful insights.
Leveraging Cloud Provider-Specific Observability Services
Cloud providers offer native observability services designed to integrate seamlessly with their infrastructure and services. Utilizing these services often provides the best performance and cost efficiency, as they are optimized for the underlying cloud environment.
- Metrics and Monitoring: Each cloud provider offers its own metric collection and monitoring tools.
- AWS: Amazon CloudWatch provides detailed metrics for a wide range of AWS services, including EC2 instances, Lambda functions, and databases. It allows you to create dashboards, set alarms, and visualize performance data.
- Azure: Azure Monitor collects metrics from various Azure resources and offers powerful visualization and alerting capabilities. Metrics can be customized to include application-specific data.
- GCP: Google Cloud Monitoring provides a comprehensive view of resource utilization, performance, and health. It supports custom metrics and integrates with other GCP services.
- Logging: Centralized logging is a core component of any observability strategy.
- AWS: Amazon CloudWatch Logs aggregates logs from various sources, including EC2 instances, Lambda functions, and application logs. CloudWatch Logs Insights enables log analysis.
- Azure: Azure Monitor Logs collects logs from various Azure resources and allows you to perform complex queries and analysis using Kusto Query Language (KQL).
- GCP: Google Cloud Logging centralizes logs from GCP services and applications. It offers powerful filtering and search capabilities, along with integration with other GCP services.
- Tracing: Distributed tracing is critical for understanding the performance of microservices-based applications.
- AWS: AWS X-Ray helps trace requests as they travel through your distributed applications. It provides detailed insights into the performance of each service and component.
- Azure: Azure Application Insights provides distributed tracing capabilities, enabling you to monitor the performance of your applications across multiple services.
- GCP: Google Cloud Trace helps you monitor and troubleshoot latency issues in your applications. It provides detailed insights into the performance of individual requests.
Integrating Third-Party Tools with Cloud Provider Services
While cloud provider-specific tools offer a solid foundation for observability, third-party tools often provide specialized features or integrations. The ability to integrate these tools is a key advantage of most cloud platforms.
- Log Management and Analysis: Tools like Splunk, Datadog, and Sumo Logic can be integrated with cloud provider services to provide advanced log analysis and management capabilities.
- Integration example: You can configure AWS CloudWatch Logs to forward logs to Splunk or Datadog for advanced analysis and correlation.
- APM and Performance Monitoring: Third-party APM tools like Dynatrace, New Relic, and AppDynamics can be integrated with cloud provider services to provide detailed application performance monitoring.
- Integration example: New Relic can be configured to collect metrics and traces from Azure Application Insights and provide a unified view of application performance.
- Alerting and Incident Management: Third-party alerting and incident management tools, such as PagerDuty and Opsgenie, can be integrated with cloud provider services to streamline incident response.
- Integration example: You can configure AWS CloudWatch alarms to trigger alerts in PagerDuty or Opsgenie, automating the incident response process.
- OpenTelemetry Integration: Many third-party tools and cloud providers are adopting OpenTelemetry, an open-source observability framework. OpenTelemetry allows you to collect and export metrics, logs, and traces from your applications in a vendor-neutral format.
- Integration example: You can use OpenTelemetry collectors to forward telemetry data to various backends, including cloud provider-specific services or third-party tools.
Observability and DevOps Practices
Observability is a critical enabler for effective DevOps practices. By providing deep insights into the behavior of applications and infrastructure, observability empowers teams to automate, optimize, and accelerate the software development lifecycle. This integration allows for faster feedback loops, improved collaboration, and ultimately, more reliable and efficient software delivery.
Observability’s Support for CI/CD
Observability significantly supports Continuous Integration and Continuous Delivery (CI/CD) by providing the necessary data to monitor, validate, and improve the entire pipeline. This support translates into faster release cycles, reduced risk, and improved software quality.
- Accelerated Feedback Loops: Observability tools capture data from various stages of the CI/CD pipeline, including code commits, build processes, testing, and deployment. This data enables developers and operations teams to quickly identify and address issues, shortening the feedback loop and allowing for rapid iteration.
- Automated Validation: Observability data can be used to automate the validation of code changes and deployments. Automated tests can be configured to check for performance regressions, errors, and other anomalies, ensuring that new releases do not negatively impact the user experience.
- Improved Collaboration: Observability provides a common source of truth for all stakeholders involved in the CI/CD process. This shared understanding facilitates collaboration between developers, operations teams, and other stakeholders, leading to faster problem resolution and more efficient workflows.
- Reduced Risk: By providing real-time insights into application behavior, observability helps to mitigate the risks associated with software releases. Teams can proactively identify and address potential issues before they impact users, minimizing downtime and ensuring a smooth deployment process.
Integrating Observability into the CI/CD Pipeline
Integrating observability into the CI/CD pipeline involves embedding observability tools and practices at each stage of the development lifecycle. This allows for continuous monitoring and feedback, enabling teams to identify and resolve issues quickly.
- Code Commit and Build: During the code commit and build stages, integrate static code analysis tools and linters to check for code quality and potential vulnerabilities. Observability tools can then monitor the build process, tracking build times, success rates, and any errors that occur.
- Testing: Implement comprehensive testing strategies, including unit tests, integration tests, and end-to-end tests. Observability tools can be used to collect performance metrics, error logs, and traces during testing, providing insights into the application’s behavior under different conditions. For example, a performance test could simulate a high user load and use observability data to identify any bottlenecks or performance degradations.
- Deployment: Integrate observability tools into the deployment process to monitor the rollout of new releases. These tools can track deployment success rates, error rates, and application performance metrics. Automated rollbacks can be triggered based on predefined thresholds, ensuring that problematic deployments are quickly reverted.
- Monitoring and Alerting: Set up comprehensive monitoring and alerting systems to detect and respond to issues in real-time. Define key performance indicators (KPIs) and set up alerts based on thresholds. When an alert is triggered, the system should automatically notify the appropriate teams, providing them with the information needed to diagnose and resolve the issue.
- Example: Consider a CI/CD pipeline using Jenkins for automated builds and deployments, Prometheus for metrics collection, Grafana for visualization, and Alertmanager for alerting. Jenkins triggers builds based on code commits. Prometheus scrapes metrics from the deployed application, and Grafana visualizes the data in dashboards. Alertmanager notifies the operations team via Slack or email if any predefined threshold is exceeded, such as a spike in error rates or a drop in response times.
Using Observability Data to Improve the Development and Deployment Process
Observability data provides valuable insights that can be used to continuously improve the development and deployment process. By analyzing this data, teams can identify areas for optimization, reduce errors, and enhance overall software quality.
- Performance Optimization: Analyze performance metrics to identify bottlenecks and areas where the application can be optimized. Use distributed tracing to pinpoint slow-performing code paths and optimize database queries. For example, a team might discover that a particular API call is consistently slow and, by examining traces, identify a poorly optimized database query as the root cause.
- Error Reduction: Analyze error logs and traces to identify the root causes of errors and implement fixes. Observability data helps to understand the context in which errors occur, enabling teams to reproduce and resolve them more effectively. For example, an error log might reveal a null pointer exception in a specific code path, leading to a targeted code fix.
- Deployment Optimization: Analyze deployment success rates, error rates, and performance metrics to identify areas for improvement in the deployment process. This might involve optimizing the deployment strategy, improving the rollback mechanism, or automating more steps in the process. For example, a team might discover that deployments are frequently failing due to a specific configuration issue, leading them to automate configuration validation steps.
- Improved Resource Allocation: Use metrics to understand resource utilization and identify areas where resources can be optimized. For example, a team might use metrics to determine that the application is over-provisioned with CPU resources during off-peak hours and can scale down the resources to save costs.
- Example: A retail company using a microservices architecture and CI/CD pipeline might observe an increase in checkout failures. By analyzing metrics, logs, and traces, the team identifies a performance issue in the payment processing microservice. Using the insights, the team optimizes the database queries within that microservice, leading to faster transaction times and a reduction in checkout failures.
Security and Observability
Observability plays a crucial role in safeguarding cloud-native applications. By providing insights into the inner workings of these applications, observability enables security teams to identify, analyze, and respond to security threats effectively. This proactive approach helps organizations maintain a robust security posture and minimize the impact of potential breaches.
Role of Observability in Identifying and Responding to Security Threats
Observability helps security teams gain a comprehensive understanding of the application’s behavior, enabling them to detect and respond to security threats in real-time. Cloud-native applications, often composed of microservices, are inherently complex. Observability tools provide the necessary visibility across all components, allowing security professionals to identify anomalies and suspicious activities that might indicate a security breach.
Observability’s capabilities include:
- Threat Detection: Observability tools can detect various threats, including unauthorized access attempts, malicious code injection, and data exfiltration. By monitoring logs, metrics, and traces, security teams can identify patterns indicative of malicious activity.
- Incident Response: When a security incident occurs, observability provides the data needed for rapid incident response. Detailed logs and traces help pinpoint the root cause of the incident, assess its impact, and contain the damage.
- Vulnerability Assessment: Observability helps identify vulnerabilities in the application and its infrastructure. By analyzing logs and metrics, security teams can detect misconfigurations, outdated software versions, and other weaknesses that attackers can exploit.
- Compliance Monitoring: Observability assists in monitoring compliance with security regulations and standards. By tracking security-related events and activities, organizations can demonstrate adherence to required security controls.
Security-Related Metrics and Logs to Monitor
Monitoring specific metrics and logs is essential for effective security observability. These data points provide valuable insights into the security posture of the application and help detect potential threats.
- Authentication and Authorization Logs: Monitor successful and failed login attempts, user access patterns, and permission changes. These logs help detect unauthorized access attempts and potential account compromises.
- Network Traffic Logs: Analyze network traffic patterns, including inbound and outbound connections, traffic volume, and source/destination IP addresses. Unusual network activity, such as excessive data transfer or connections from suspicious IP addresses, may indicate a security breach.
- Application Activity Logs: Track application events, such as API calls, database queries, and file access attempts. These logs provide insights into application behavior and can help identify malicious activity, such as SQL injection attacks or unauthorized data access.
- Security Event Logs: Monitor security-related events, such as intrusion detection alerts, security policy violations, and malware detections. These logs provide real-time insights into potential security threats.
- System Metrics: Monitor system-level metrics, such as CPU usage, memory consumption, and disk I/O. Sudden spikes in these metrics can indicate resource exhaustion attacks or other malicious activities.
- Container Security Metrics: Monitor container-specific metrics, such as container startup/shutdown events, image vulnerabilities, and network policies. These metrics are critical for securing containerized environments.
Methods for Using Observability to Detect and Investigate Security Incidents
Leveraging observability effectively requires implementing specific methods for detecting and investigating security incidents. These methods enable security teams to proactively identify and respond to threats.
- Anomaly Detection: Use machine learning and statistical analysis to identify unusual patterns in logs and metrics. Anomaly detection can help identify suspicious activities that might indicate a security breach. For instance, an unexpected spike in login failures from a particular IP address could signal a brute-force attack.
- Correlation and Aggregation: Correlate data from different sources to gain a comprehensive view of security events. Aggregate related events to identify trends and patterns that might be missed by analyzing individual data points. For example, correlating authentication logs with network traffic logs can help identify compromised accounts used for malicious purposes.
- Real-Time Monitoring and Alerting: Implement real-time monitoring and alerting to detect security threats as they occur. Configure alerts based on specific thresholds or patterns in logs and metrics. For instance, setting up an alert for a sudden increase in failed login attempts or unusual network traffic.
- Root Cause Analysis: Use logs and traces to investigate the root cause of security incidents. Trace requests across microservices to identify the origin of the attack and understand its impact. For example, tracing a malicious API call through various microservices to identify the source and the affected data.
- Threat Hunting: Proactively search for potential threats by analyzing logs and metrics. Develop threat hunting strategies to identify and investigate suspicious activities that might not be immediately apparent. This could involve searching for specific indicators of compromise (IOCs) or analyzing unusual user behavior.
- Security Information and Event Management (SIEM) Integration: Integrate observability tools with a SIEM system to centralize security data and streamline incident response. The SIEM system can correlate data from various sources, generate alerts, and provide a comprehensive view of security events.
The Future of Observability

Observability is not static; it’s a rapidly evolving field, driven by the increasing complexity of cloud-native applications and the need for faster, more automated incident resolution. The future of observability promises to be even more sophisticated, intelligent, and integrated, enabling organizations to proactively manage their applications and infrastructure with unprecedented efficiency.
Emerging Trends: AIOps and Automated Root Cause Analysis
A significant trend in observability is the rise of AIOps (Artificial Intelligence for IT Operations). AIOps leverages machine learning and artificial intelligence to automate many aspects of observability, including anomaly detection, root cause analysis, and performance optimization.
The application of AIOps in observability offers several key benefits:
- Automated Anomaly Detection: AIOps systems can analyze vast amounts of data from logs, metrics, and traces to identify anomalies in real-time. This allows teams to proactively address issues before they impact users.
- Automated Root Cause Analysis: Instead of manually sifting through data, AIOps tools can automatically pinpoint the root cause of an incident by analyzing relationships between different data points. For example, if a latency spike is detected, the AIOps tool could correlate it with increased database query times and identify the problematic queries.
- Predictive Analytics: AIOps can use historical data to predict future performance issues and proactively alert teams. For instance, it can forecast when a server might run out of resources based on usage patterns.
- Reduced Mean Time to Resolution (MTTR): By automating the detection and diagnosis of issues, AIOps significantly reduces the time it takes to resolve incidents.
Another crucial aspect of the future of observability is automated root cause analysis. This involves using machine learning algorithms to automatically identify the underlying cause of a problem, reducing the need for manual investigation. For example, a system could automatically identify that a specific code deployment introduced a performance regression by analyzing metrics before and after the deployment.
Observability in Serverless Applications
Serverless computing presents unique challenges and opportunities for observability. The ephemeral nature of serverless functions and the distributed nature of serverless architectures make traditional monitoring approaches inadequate. Observability in the serverless context focuses on several key areas:
- Function-Level Monitoring: Monitoring the performance and health of individual serverless functions is crucial. This includes tracking execution times, memory usage, and error rates. Tools often provide function-specific dashboards and alerts.
- Distributed Tracing: Because serverless applications often involve multiple functions interacting with each other, distributed tracing is essential to understand the flow of requests and identify bottlenecks. Tracing helps visualize the end-to-end journey of a request across different functions and services.
- Log Aggregation and Analysis: Serverless functions generate logs, but these logs can be dispersed across various cloud services. Effective observability requires centralized log aggregation and analysis to correlate events and identify issues.
- Cost Optimization: Observability tools can help monitor the cost of serverless functions by tracking resource consumption and identifying areas for optimization. For example, they can identify functions that are over-provisioned or inefficient.
The key is to instrument serverless functions with observability tools to capture data on their execution, performance, and dependencies. Observability platforms often provide specialized integrations for serverless platforms like AWS Lambda, Azure Functions, and Google Cloud Functions. For instance, a team might use AWS CloudWatch to monitor Lambda function invocations, errors, and duration, and use X-Ray for distributed tracing across their serverless applications.
Evolving Vision of Observability
Looking ahead, the evolution of observability will likely be characterized by increased automation, integration, and intelligence.
- Increased Automation: Automation will play a central role in observability. This includes automated instrumentation, automated data collection, and automated analysis. Tools will automatically detect anomalies, identify root causes, and even suggest remediation steps.
- Seamless Integration: Observability will become more deeply integrated with other aspects of the software development lifecycle, such as CI/CD pipelines and incident management systems. This will enable faster feedback loops and more efficient incident response.
- Proactive Observability: Observability will shift from a reactive approach to a proactive one. Instead of just responding to incidents, organizations will use observability data to predict and prevent issues before they occur.
- Enhanced User Experience: Observability tools will become more user-friendly, with intuitive dashboards, customizable alerts, and easy-to-understand visualizations. The goal is to make it easier for teams to understand their systems and take action.
- Focus on Business Outcomes: Observability will be increasingly tied to business outcomes. Organizations will use observability data to measure the impact of their applications on key metrics, such as customer satisfaction, revenue, and user engagement.
The future of observability is about empowering teams to build and operate resilient, high-performing applications with greater efficiency and agility.
Final Conclusion
In conclusion, mastering observability is vital for the success of cloud-native applications. By understanding the core concepts, implementing the right tools, and adopting best practices, you can gain unparalleled insights into your systems, improve performance, and ensure a resilient and secure cloud-native infrastructure. Embrace observability, and unlock the full potential of your applications.
FAQ Explained
What are the main differences between monitoring and observability?
Monitoring focuses on predefined metrics and alerts, while observability provides a broader view, enabling you to understand the “why” behind issues by examining logs, metrics, and traces.
How does observability help with troubleshooting in cloud-native environments?
Observability allows you to quickly identify the root cause of problems by correlating data from logging, metrics, and tracing, helping to pinpoint issues across distributed services.
What are the advantages of using structured logging?
Structured logging makes it easier to parse and analyze logs, enabling more efficient searching, filtering, and aggregation of log data for better insights.
What are some common open-source observability tools?
Popular open-source tools include Prometheus for metrics, Grafana for visualization, the ELK Stack (Elasticsearch, Logstash, Kibana) for logging, and Jaeger or Zipkin for tracing.