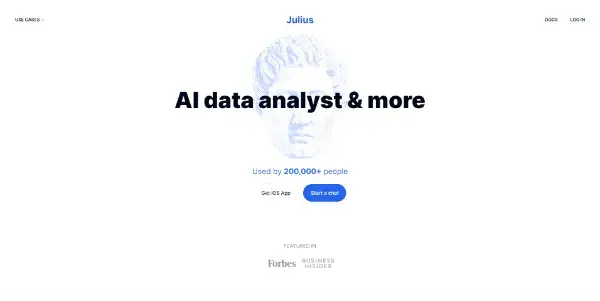
Julius.ai

An expert who simplifies data analysis and visualisation (CSV and Excel). Let Julius analyse, clean up or create dynamic animations
Julius.ai: Streamlining Data Analysis and Visualization
Julius.ai is a powerful AI-powered tool designed to simplify and accelerate data analysis and visualization for business users. It excels at handling common data formats like CSV and Excel files, offering users a range of functionalities to clean, analyze, and present their data in compelling and insightful ways – all without requiring extensive technical expertise. Categorized under Business, Files & Spreadsheets, and Productivity tools, Julius.ai aims to empower individuals and teams to extract meaningful insights from their data quickly and efficiently.
What Julius.ai Does
At its core, Julius.ai acts as an expert data analyst, automating many of the tedious and time-consuming tasks associated with data preparation and presentation. It leverages AI to:
- Clean and prepare data: Automatically detects and handles inconsistencies, missing values, and data errors within CSV and Excel files.
- Analyze data: Identify trends, patterns, and outliers within datasets, providing users with summaries and key insights.
- Create visualizations: Generate dynamic charts, graphs, and even animations to represent data effectively, making complex information easily understandable.
Main Features and Benefits
Julius.ai offers several key features that contribute to its efficiency and user-friendliness:
- Automated Data Cleaning: Saves significant time and effort by automatically identifying and rectifying data quality issues.
- Intuitive Interface: Designed for ease of use, even for users with limited data analysis experience.
- Customizable Visualizations: Allows users to tailor charts and graphs to meet specific needs and presentation styles.
- Dynamic Animations: Creates engaging animated visualizations to highlight data trends and patterns effectively.
- Time-Saving: Automates many manual processes, freeing up users to focus on strategic decision-making.
- Improved Accuracy: Reduces the risk of human error in data analysis and interpretation.
- Enhanced Insights: Provides deeper and more comprehensive insights from data, enabling data-driven decisions.
Use Cases and Applications
Julius.ai finds application across various industries and use cases, including:
- Business Intelligence: Analyzing sales data, customer behavior, and market trends to identify opportunities and improve business strategies.
- Financial Analysis: Analyzing financial statements, investment performance, and risk assessments.
- Marketing Analytics: Understanding campaign performance, customer segmentation, and marketing ROI.
- Operations Management: Monitoring key performance indicators (KPIs), identifying bottlenecks, and optimizing processes.
- Research and Development: Analyzing experimental data, identifying trends, and supporting decision-making.
Comparison to Similar Tools
While several tools offer data analysis and visualization capabilities, Julius.ai distinguishes itself through its AI-powered automation and focus on ease of use. Compared to tools requiring extensive coding skills or complex configurations, Julius.ai offers a more accessible and intuitive experience, making powerful data analysis capabilities available to a wider range of users. Tools like Tableau and Power BI require more technical expertise and often involve a steeper learning curve. While they may offer a broader range of functionalities, Julius.ai excels in its streamlined approach to automating the most common data preparation and visualization tasks.
Pricing Information
Julius.ai operates on a paid subscription model. Specific pricing details, including subscription tiers and features included in each tier, are available on the Julius.ai website. It's recommended to visit their pricing page for the most up-to-date information.
In conclusion, Julius.ai represents a significant advancement in accessible data analysis and visualization. Its AI-powered automation, user-friendly interface, and ability to generate compelling visualizations make it a valuable tool for businesses and individuals looking to extract meaningful insights from their data without needing extensive technical skills.